
Have you bought a stock on someone’s advice to make quick profits and then waited for months, may be years, to just recover your capital?
90% of retail investors fall to that trap and loose money in the the market. Just by reading this article till the end, it will change your perception towards market completely. Understand WHY YOU ARE LOOSING MONEY IN THE MARKET and how YOU can move out of those 90% people into 10% who make money from it?
Revealed on this page…
- Why 90% of investors lose money in market: How you can make a move to those 10% investors who profit from market.
- The long term investor misconception: Just being a long term investor in market is not enough.
- Market secret that Foreign Institutional Investors or FIIs don’t want you to know: How knowing those can change your perception towards the market.
- DIYTechnicalAnalysis – My system that has transformed hundreds of retail trader and investor to a pro trader and investor.
- YOURS FREE – Lifetime access to private members only forum: Discuss trading and investing ideas with me and other like minded Indian retail traders and investors.
You’ve tried tips from experts on TV. You’ve started and stopped dozen’s of different stock tips services, perhaps attended several different investment seminars, and have read the best books on technical analysis, fundamental analysis, candlestick chart patterns but the truth is you just can’t seem to be consistently profit in market.
Perhaps you are feeling a little disgusted with yourself and your inability to make a profit in the market. You feel like no matter what you try, its not going to work.
If you have tried everything and still nothing seems to be working and you are just compounding losses, you have come to the right place and you are about to read the letter you’ve been waiting for all your life.
Do you know Indian retail investors need to lose money in the market?
Shocked!!!
Yes it’s quite an eye opener truth that you need to know.
Let me try to explain.
Money is neither created nor destroyed in market, it is a zero sum game (excluding the brokerage and exchange costs) which means someone has to loose money if others are making profit in it because the sum total of all the money in the market is the money invested by all investors.
In simple terms, it means investing in market does not print money for people making a profit from the market. If someone is taking the profit out of the market, it is at the cost of someone else losing the same amount in the market.
But because there are millions of participants in an exchange, you don’t realize it as a zero sum game.
You invested and made profit. It means you purchased a stock at a lower price and sold at a higher price. The person who brought it from you is anticipating it will go even higher (like you anticipated when you purchased it) and the person last in the chain which is more often a retail investor will have to either remain invested for an elongated period of time to break even or get tired and eventually book a loss.
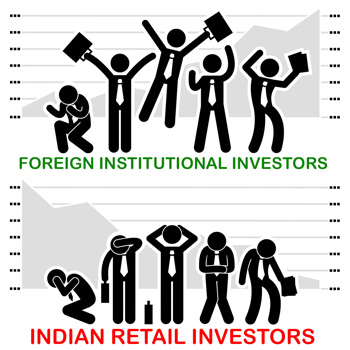
If large investors or FII’s want to be making big profits in market, hundreds of thousands of small investors needs to lose money and still remain invested in the market for those big investors to consistently make profits.
Will you allow those large investors and FIIs to snatch away your hard earned money without you doing anything about it?

I did not permit it.
Let me share with you how I got started.
I am Shabbir Bhimani and like any other investor I also started to look at the market as money making opportunity. When the markets were booming in 2007, I did my first trade on 22nd June 2007 and purchased MAN INDUSTRIES (INDIA) LIMITED. In a day or two, I was richer by Rs 300 on an investment of Rs.50,000.
I started multiplying numbers. Daily 300 Rs could mean I can easily make more than my job. Hurray !!! I was on top of the world and wanted to invest a lot more and started to look for more source of funds.
Soon reality kicked in and I realized that it is not as easy as it was for the first time. I had some decent gains but I also realized that those were one time gains and I am not able to repeat them on a constant basis.
I tried really hard to repeat my gains without much knowledge back then but not only I lost my earlier gains but even quite a bit of my capital.
As famous quotes say “You Learn More From Your Losses Than Your Wins” and the same applied to me.
Despite my losses, I was convinced that there’s money to be made from the stock market but there is something that is not transparent to me. If money cannot be made from the stock market, why are so many big investors keep investing in market and why the turnover in the exchanges all over the world is ever increasing.
This is when I started to study market from various aspects and it help me understand
- How to spot the right stock from thousands being traded?
- How to determine the right price of the stock?
- How to find the right time to invest in a stock?
- How to avoid market fears?
- How to control market greed?
- How to book a loss and yet be profitable in the market?
- How to not over diversify in market and invest with focused approach?
I am B.Tech in Information Technology and have no financial education and always wanted to be in equity market more as an investor and a personal hobby, but I found that there is so much of crap information just to loot Indian retail investors.
The amount of noise in the finance domain leads me to DIYTechnicalAnalysis (Do It Yourself Technical Analysis) which is the fastest, easiest, best and the only possible way of making money from the market.
If I can, anybody can because now you have the proof that it can be done without those financial degrees.
Why and how we are being manipulated?

Remain invested and you will ultimately make profit.
You are constantly reminded to be a long term investor which means you make loss initially and then compound your losses over an elongated period of time and yet remain invested.
We know market is a zero sum game and if Indian retail investors start to make money from market, FII and mutual funds will not be able to make profit and so they want Indian retail investors to participate in market and remain invested for an elongated period of time without making any profit out of it.
- Any long term investor can make money in market – Wrong.
- You cannot time the market – Wrong.
- Fundamental analysis is about ratios like earnings per share or EPS, Debt equity ratio – Wrong.
FIIs have a systematic approach to manipulate our views of the market.
Have you ever wondered why big investment houses share their views about particular stocks on news channels? Why do they share their research about outperform / underperform for any particular stocks? What do they gain out of it?
How being a long term investor in even the best-est of stocks for an elongated period of time is just not enough?
Sensex chooses the best stock in the business. So let us take all the Sensex listed companies. Take their price in 21st Feb 2011 (Random date in 2011) and compare them with 2016 (21st Feb 2016). The price is as follows.
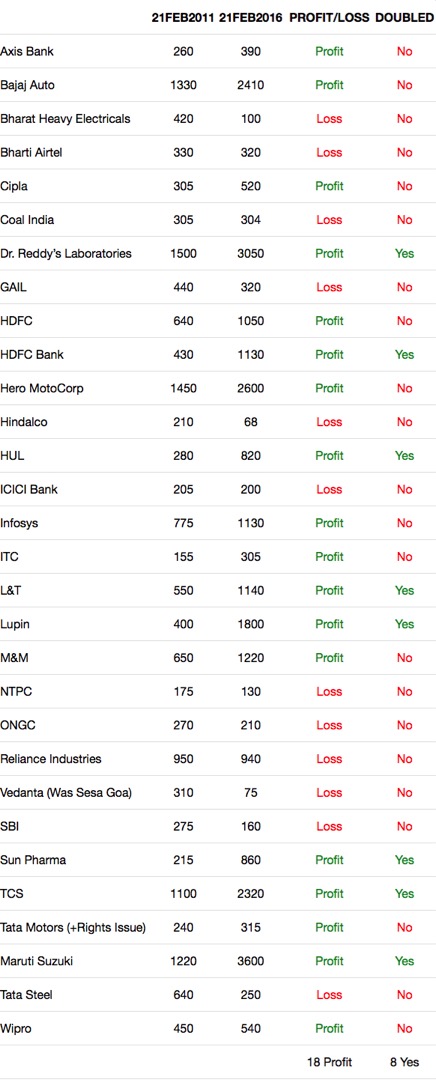
If you invest in the best stocks in emerging India in the best era for the market (2011 to 2016), your probability of just being profitable after remaining invested for 5 long years is mere 18 out of 30 or 60% (Probability of 0.6).
It can also mean 40% chances are if you select the best stocks in the business from India’s best index and remain invested for a long period of 5 years you can still be making loss.
In 5 years only 8 (Maruti, TCS, Sun Pharma, Lupin, L&T, HUL, HDFC Bank, Dr Reddy’s Lab) out of 30 stocks doubled and if we become slightly lenient in calculations 11 (ITC, M&M and HDFC included) out of 30 stocks doubled. So there is only 35% chances you will double your money in 5 years investing in blue chip stocks.
Do you still prefer to be a long term investor in any stock or you want to be investing in the right stocks?
Real Testimonials of Real People
Let me share what others are saying about the DIY approach. Note these are real testimonials from real members in our DIYTechnicalAnalysis members area that you can verify as soon as you have access to members forum. If you find even a single discrepancy in it, you can ask for no questions asked refund.
DIYTechnicalAnalysis Solution
An eBook that can convert you from a retail investor who can be trapped by big investor to a pro trader and investor. If you buy the understanding chart pattern eBook now, you also get a bonus lifetime FREE access to private members only forum where you can ask me any questions that you have about any trading or investing opportunities.
Click the button below, fill out the order form at Clickbank (high security payment solution provider), and I will immediately send you access to the eBook along with access to our private members forum on your email. You will have everything you need in minutes to get started.

DIYTA is lifetime unconditional 200% money back guarantee.
DIYTA can transform you from a loss making individual to a pro trader and investor so you can build an alternate source of income with your trading and investments.
If at any given point of time, you discover that you have not been transformed to a pro trader and investor, just drop an email and your refund will be processed immediately. I have kept refund process really simple and there are no terms and conditions, no forms to fill nothing to prove, not even a single question asked.
I provide a 200% money back which means I will not only refund your money but you can also keep my eBook for the rest of your life. Just for the record, I have made 1683 sales and haven’t had a single refund request.
I know you are at the point of decision.
You can either continue to follow the path you have already been following, or you can choose the path less followed. The path you have been following will probably result in you getting the same result you have always received.
But if you want something different to happen, if you want to change the direction of your investment you’re going to have to do something different. Make a new choice, and pursue a new outcome.
Rest assured you will not be alone. I am going to hold your hand at every step of the way and walk you through the complete process of transforming you to a pro trader and investor.